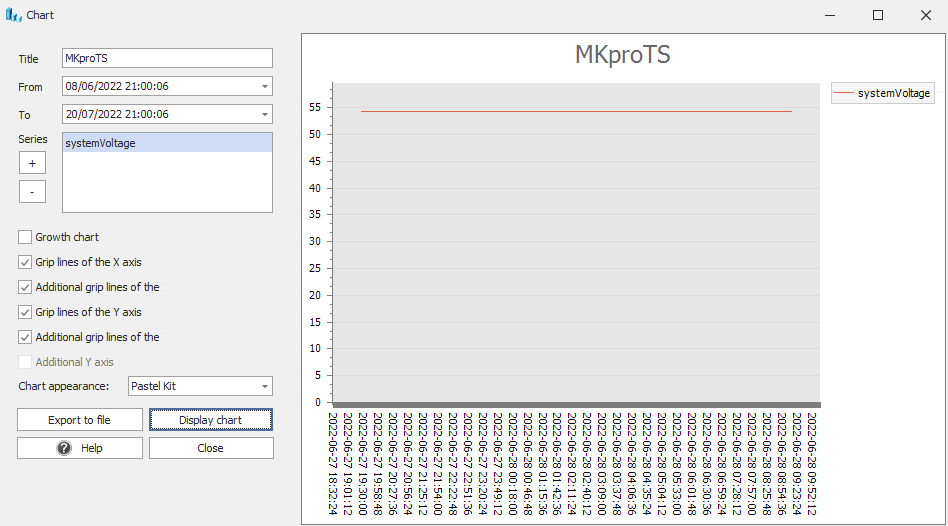
Creation and export of the site’s properties charts.
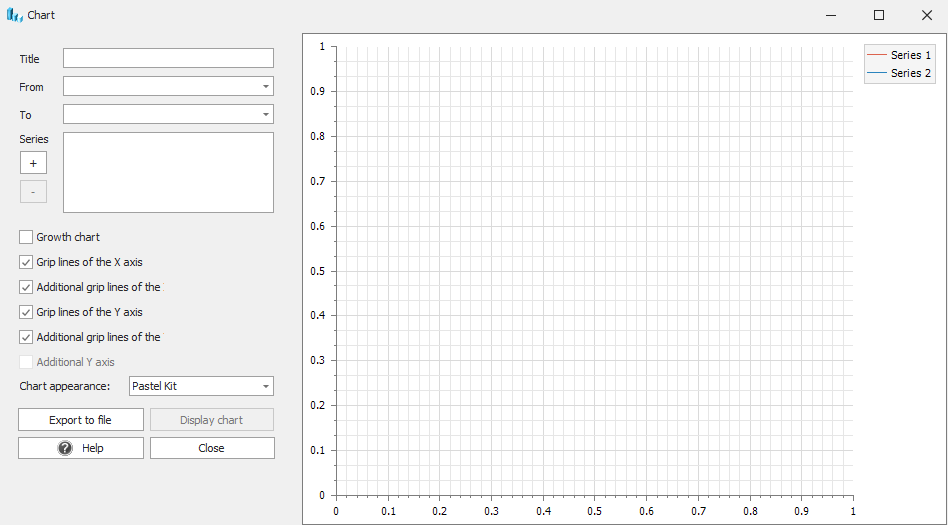
After opening the "Chart" window it is necessary to enter Title of the chart, select time period and then click "+" in order to add a range of data to be presented in the chart.
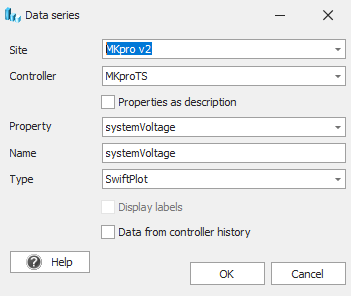
It is important to add Name of the range of data at first. Then select the site, controller and property which shall be presented in the chart. It is also possible to choose one of three types of charts. After entering all the data it is necessary to approve with "OK".
|