Alarms, measurements and additional information regarding the site are presented in the site’s status window.
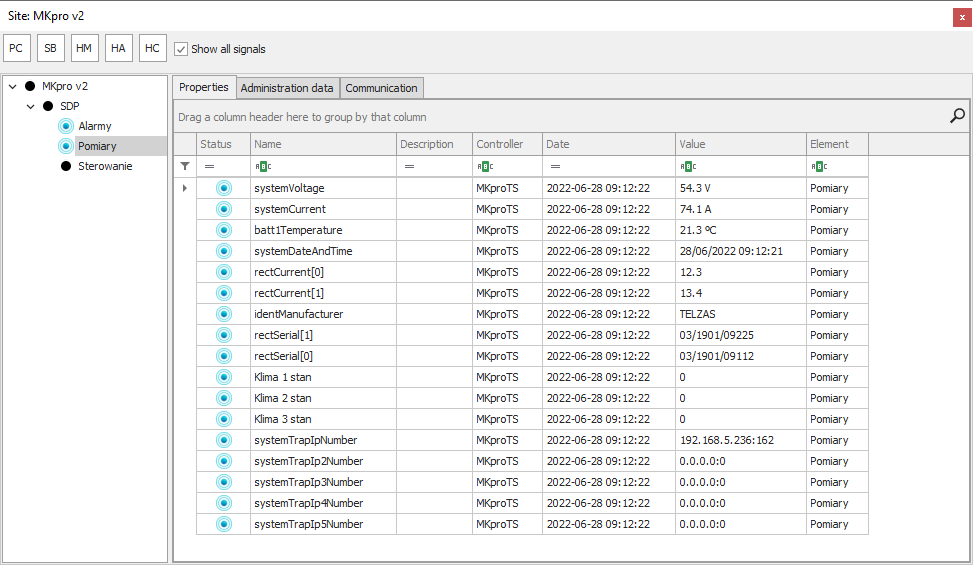
The groups are presented in the form of a tree displayed in the left side of the window. Data regarding the site and its elements are presented in the in the right side in two tables (Properties and Administration data). These are the signals from the site (from all the elements) or marked element (together with signals from inferior elements). The following columns are available in this table :
| • | Status (its values may be in accordance with the list of statuses in the List of sites) |
| • | Value (with the unit if it is a measurement) |
The following commands are available in the hand-held menu of the site’s tree :
| • | Poll controllers – sends questions to the controllers of the Site |
Selecting History of events command will cause moving the user to the History of events window and displaying data filtered by site (and set site, the command was sent from). History of measurements acts similarly.
In pop-up menu of the list of signals, orders are accessible:
| • | Save arrangement of the table |
|